LGBTQ+ Livelihoods: Uneven Geographies of Work and Inclusion

LGBTQ+ Livelihoods: Uneven Geographies of Work and Inclusion
The research team aimed to address the gap in understanding LGBTQ+ employment experiences in Canada, particularly in resource and manufacturing-based regions such as northern and southwestern Ontario, which had been overlooked in previous studies. It aimed to provide both quantitative and qualitative insights into the challenges faced by LGBTQ+ workers in these regions, specifically in the mid-sized cities of Sudbury and Windsor and their surrounding areas.
Additionally, the research investigated the role of unions in promoting inclusivity and mitigating adverse employment experiences for LGBTQ+ individuals. The ultimate goal was to identify strategies and develop tools that could be utilized by unions, worker centers, and LGBTQ+ community members to foster inclusion in both union and non-union workplaces.
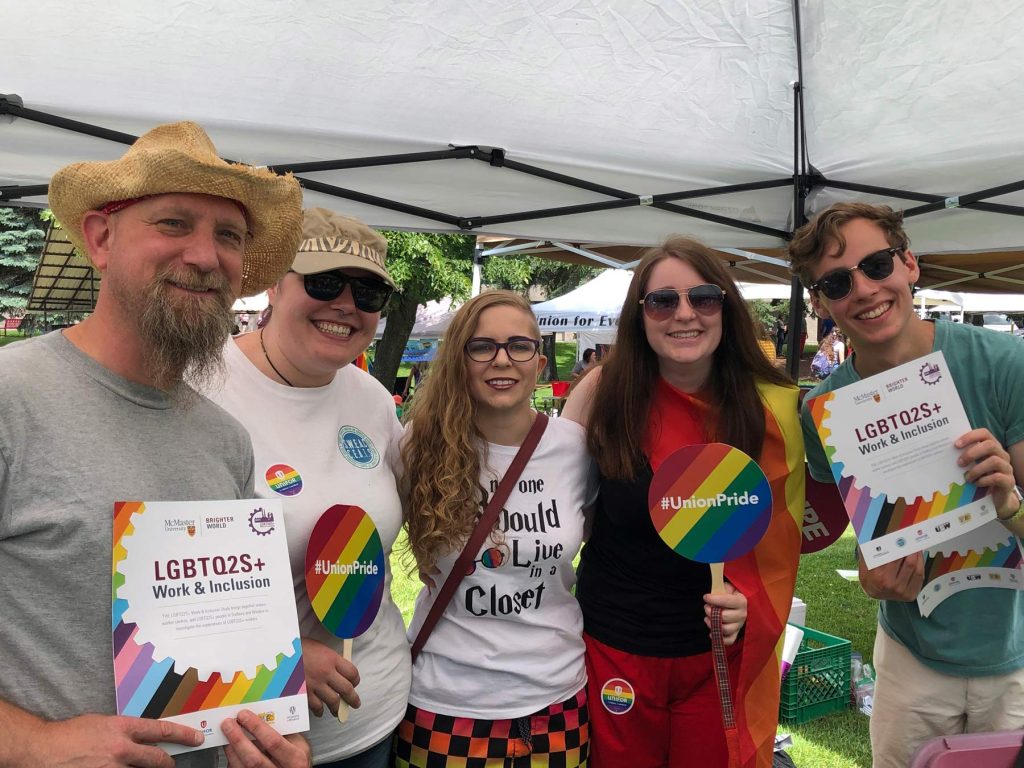
Meet the Team
Suzanne Mills: Associate Professor, Labour Studies
Adriane Paavo: Education & Equality Department Leader United Steelworkers
Sarah McCue: National Representative- Communications LGBTQ
Natalie Oswin: Associate Professor, Department of Human Geography, University of Toronto Scarborough
Adrian Guta: Assistant Professor, School of Social Work, University of Windsor
Nathaniel Lewis: Epidemic Intelligence Service, Centre for Disease Control and Prevention, Utah Department of Health
Research
In 2018, 677 people, 408 from Sudbury and 269 from Windsor, completed an e-survey about their experiences at work and in the community. The age of survey participants ranged from 16 to 69, and young people were particularly well represented (54.9% of participants under the age of 30). 14.5% of the sample identified as racialized non-white, and 12.6% identified as Indigenous.


Although nearly half of participants reported being ‘out’ in most areas of their social lives, participants who were racialized as non-white reported much lower rates of being out in the community, with only 24.1% out in all or most settings.


Additionally, while LGBTQ2S+ spaces are important areas for developing community, not everyone reported feeling comfortable in these environments. In addition to regional differences, Indigenous and racialized people reported feeling less comfortable than those who identified as white, and only 59.82% of all participants felt comfortable all or most of the time—highlighting the need for broader inclusivity.

What is more, nearly half of workers in the private sector and over a quarter of workers in the public sector reported changing their appearance, dress, mannerisms, or behaviour at work to ‘fit in’. 38.6% of survey participants were members of a union. Indigenous people were less likely to be unionized than other respondents.

Workers also left jobs due to racist and unsupportive environments at work. Indeed, 22.22% of racialized respondents reported leaving work due to racism, and 26.83% of transgender respondents reported leaving a job because it was not a positive environment for LGBTQ2S+ employees.

People reported high rates of discrimination from other employees, with racialized workers, as well as non-binary, and transgender people, reporting higher rates than white people and cis-gendered people, respectively.

Of union members with an opinion, 59.79% said that the union mostly or completely protected them from discrimination, although only 47% said they would go to their union if they were experiencing discrimination at work.

Only 28.28% of union members were out to people in their union—such as stewards or staff—a number that was higher for private sector workers.

Rates of being ‘out’ at work were similar for both regions. Most workers were not out to their boss or supervisor.
Almost three-quarters of participants indicated that they had experienced a mental health issue related to work during the past years.


The most commonly reported mental health issues related to work were anxiety, depression, and panic attacks. More than half of the participants said they had experienced anxiety related to work in the past year.
Almost half of participants used some type of substance specifically to cope with work. Alcohol, cannabis and tobacco were unsurprisingly the most commonly used substances, but more than 5% of participants were using benzodiazepines—a form of tranquilizer that becomes dangerous when mixed with alcohol or other substances.


People were more likely to use substances if their workplace did not support their gender identity or sexuality.
